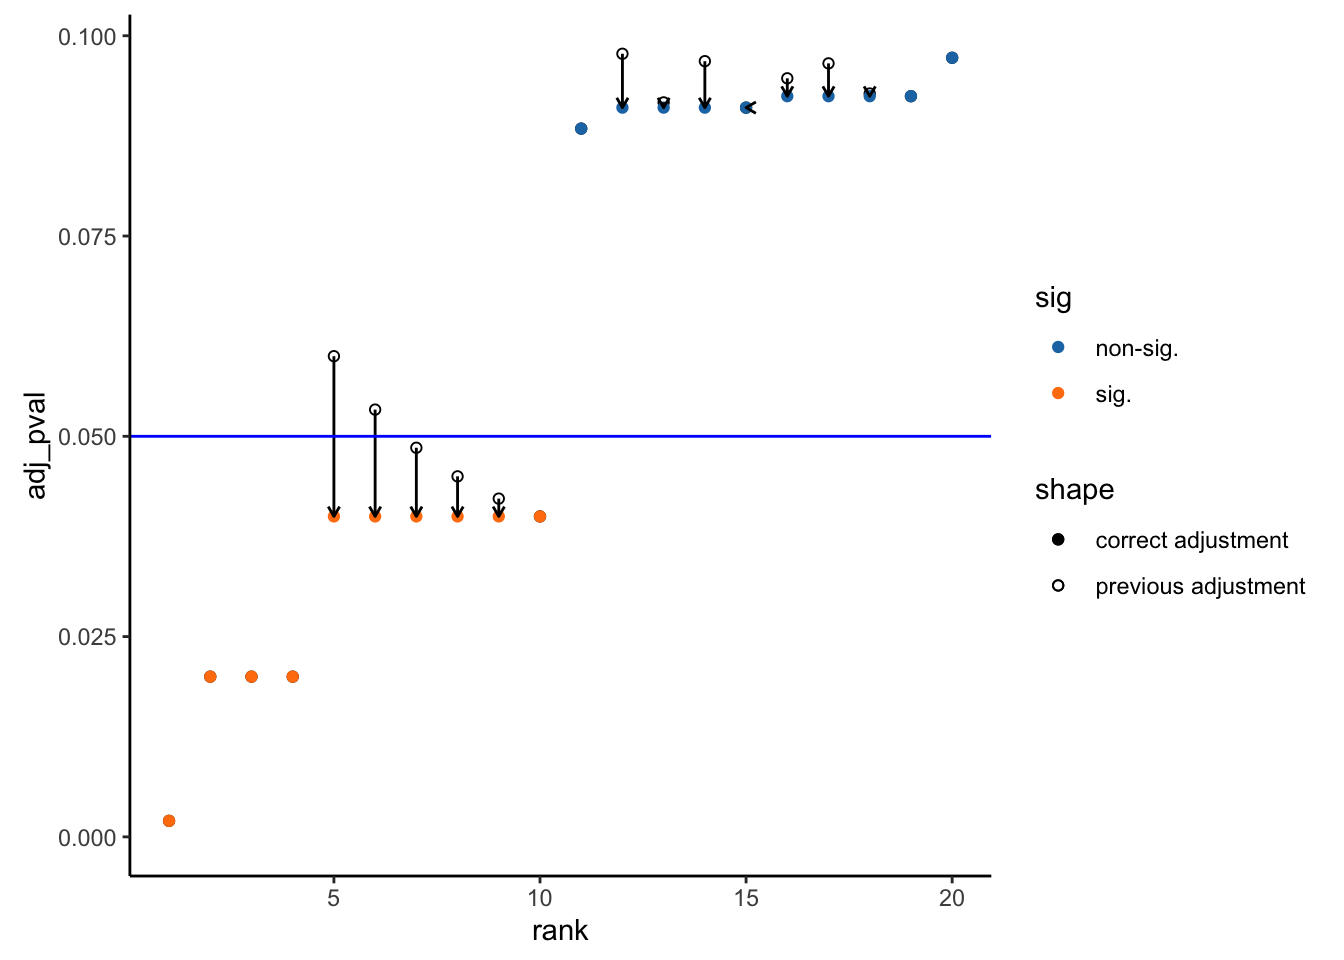
In this post, we look into the so-called FDR-adjusted \(p\)-values implemented by p.adjust() with method = "BH". To this end, we create a list of \(n=20\) nominal \(p\)-values and rank them in increasing order:
library(tidyverse)
library(ggrepel)
library(ggsci)

nom_pval <- c(0.01600000, 0.05865014, 0.08350898, 0.08783160, 0.06777848,
              0.08206850, 0.01800000, 0.09725057, 0.00200000, 0.00010000,
              0.04862445, 0.00300000, 0.01500000, 0.07574901, 0.05959104,
              0.01900000, 0.01700000, 0.00400000, 0.02000000, 0.06827007)
n <- length(nom_pval)
d <- tibble(sorted_pval = sort(nom_pval), rank = 1:n)
Set the significance level \(\alpha=0.05\), and consider the following plot, where the red line represents \[y = \frac{\alpha}{n}\times\text{rank}.\]
alpha = 0.05
d <- d %>%
  mutate(is.under = sorted_pval <= alpha/n*rank) %>%
  mutate(is.last = ifelse(rank == which(.$is.under) %>% max(), "last rank\nunder the line", "")) %>%
  mutate(sig = ifelse(rank <= which(.$is.under) %>% max(), "sig.", "non-sig."))

d %>%
  ggplot(aes(rank, sorted_pval)) +
  geom_point(aes(color = sig)) +
  scale_color_d3() +
  geom_text_repel(aes(label = is.last), nudge_x = 1) +
  ylim(c(0, NA)) +
  geom_abline(intercept = 0, slope = alpha/n, color = "red") +
  theme_classic() +
theme(aspect.ratio = 1) 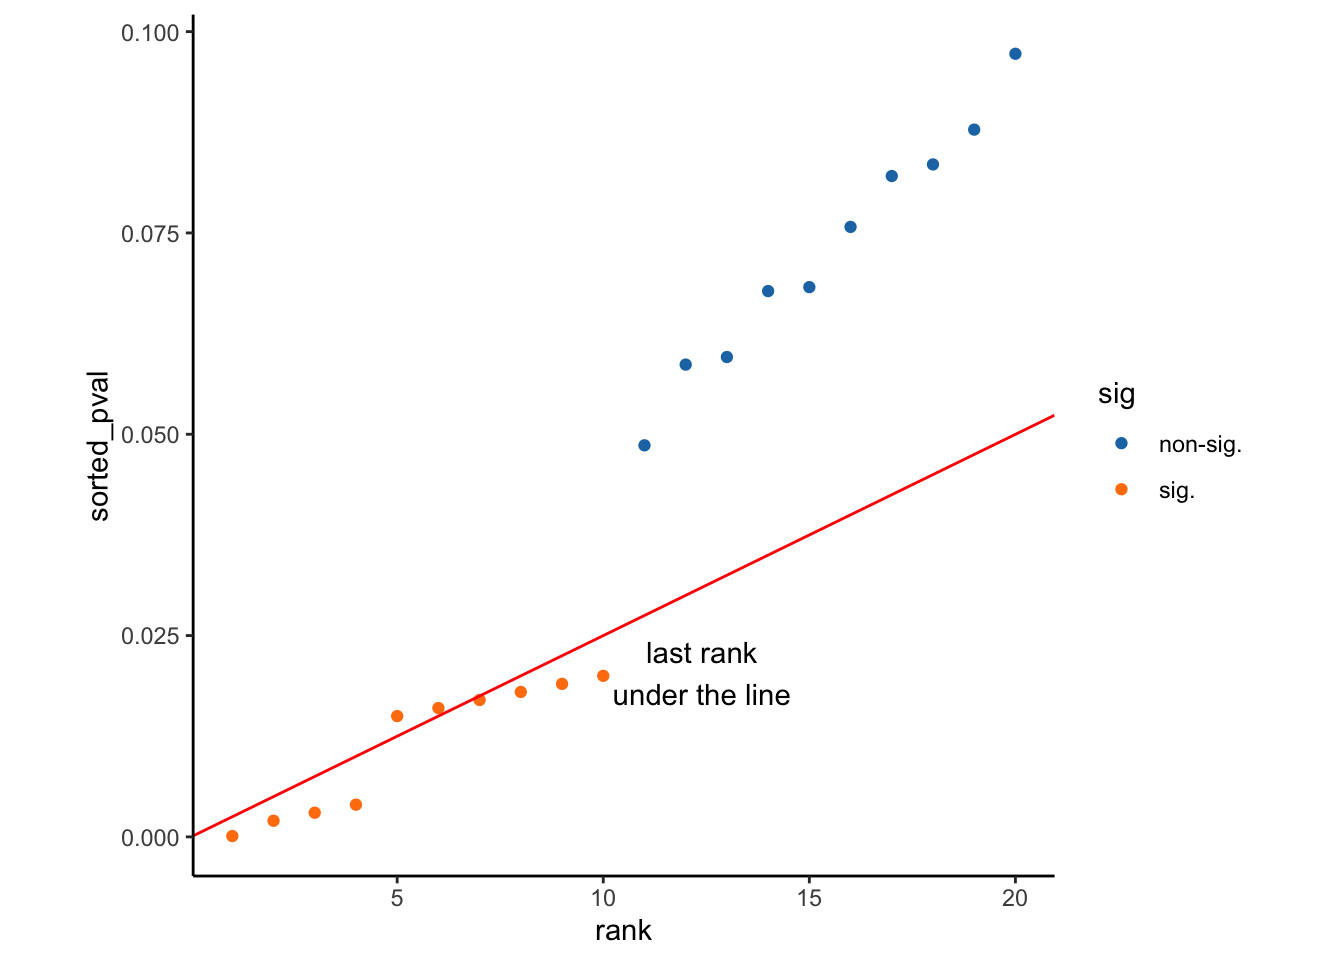
According to Benjamini-Hochberg, declaring discoveries for all \(p\)-values less than or equal to the largest \(p\)-value under the line controls the false discovery rate, in the sense that the expected proportion of false discoveries would be less than or equal to \(\alpha=0.05\).
In practice, it would be convenient to adjust the nominal \(p\)-values and determine the significance by comparing the adjusted \(p\)-values to \(\alpha=0.05\). From the condition that \[p \leq \frac{\alpha}{n}\times\text{rank},\] it is tempting to revise the \(p\)-value by multiplying it by \(\displaystyle{\frac{n}{\text{rank}}}\) (and declare significance if this revised value is less than \(\alpha=0.05\)). It is not quite simple though, as can be seen below:
d <- d %>%
  mutate(rev_pval = sorted_pval*n/rank) %>%
  mutate(is.problem = ifelse(sig == "sig." & rev_pval > alpha, "problem", ""))

d %>%
  ggplot(aes(rank, rev_pval)) +
  geom_point(aes(color = sig)) +
  scale_color_d3() +
  geom_text_repel(aes(label = is.problem), nudge_x = 1) +
  ylim(c(0, NA)) +
  geom_hline(yintercept = alpha, color = "blue") +
  theme_classic() +
  theme(aspect.ratio = 1)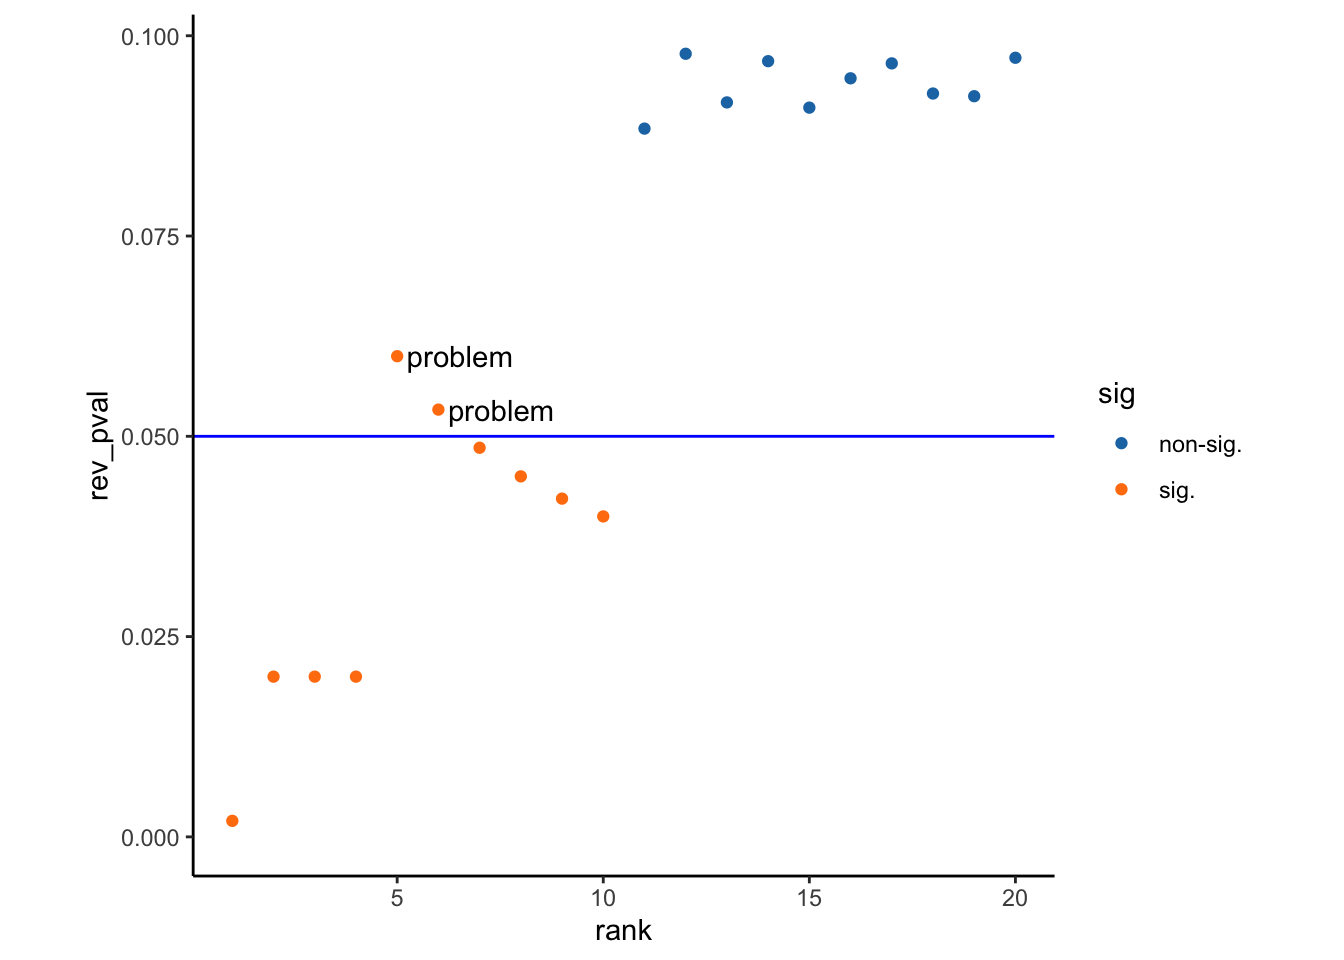
Notice that there are a couple of problematic points that are above \(\alpha=0.05\). If we declare significance based on these revised \(p\)-values, we would lose these potential discoveries. To fix this, we need to adjust the original nominal \(p\)-values in a way keeping these points under \(\alpha=0.05\). This is accomplished in p.adjust() with method = "BH" option (using cummin function).
d <- d %>%
  mutate(adj_pval = p.adjust(sorted_pval, method = "BH"))

d %>%
  ggplot(aes(rank, adj_pval)) +
  geom_point(aes(y = rev_pval, shape = "previous adjustment")) +
  geom_point(aes(color = sig, shape = "correct adjustment")) +
  geom_segment(data = d %>% filter(rev_pval > adj_pval),
               aes(x = rank, y = rev_pval, xend = rank, yend = adj_pval),
               arrow = arrow(length = unit(0.15, "cm"))) +
  scale_color_d3() +
  scale_shape_manual(values = c(19, 1)) +
  ylim(c(0, NA)) +
  geom_hline(yintercept = alpha, color = "blue") +
  theme_classic() +
  theme(aspect.ratio = 1)