library(usedist)
library(tidyverse)
library(ggforce)
library(ggsci)
library(gt)
library(ggrepel)
library(ggdendro)
First, we make a fake data set:
make_fake <- function(group, n) {
  tibble(x = rnorm(n, sample(10, 1), sample(2, 1)),
         y = rnorm(n, sample(10, 1), sample(2, 1)),
         group = group)
}
set.seed(2019)
df <- map(LETTERS[1:5], make_fake, n = 6) %>%
  bind_rows() %>%
  group_by(group) %>%
  mutate(SampleID = paste0(group, 1:n())) %>%
  ungroup()
Visualization of the data:
ggplot(df, aes(x, y)) +
  geom_point(aes(shape = group), show.legend = FALSE) +
  geom_mark_hull(aes(label = group, fill = group),
                 show.legend = FALSE) +
  scale_fill_npg() +
theme_void() 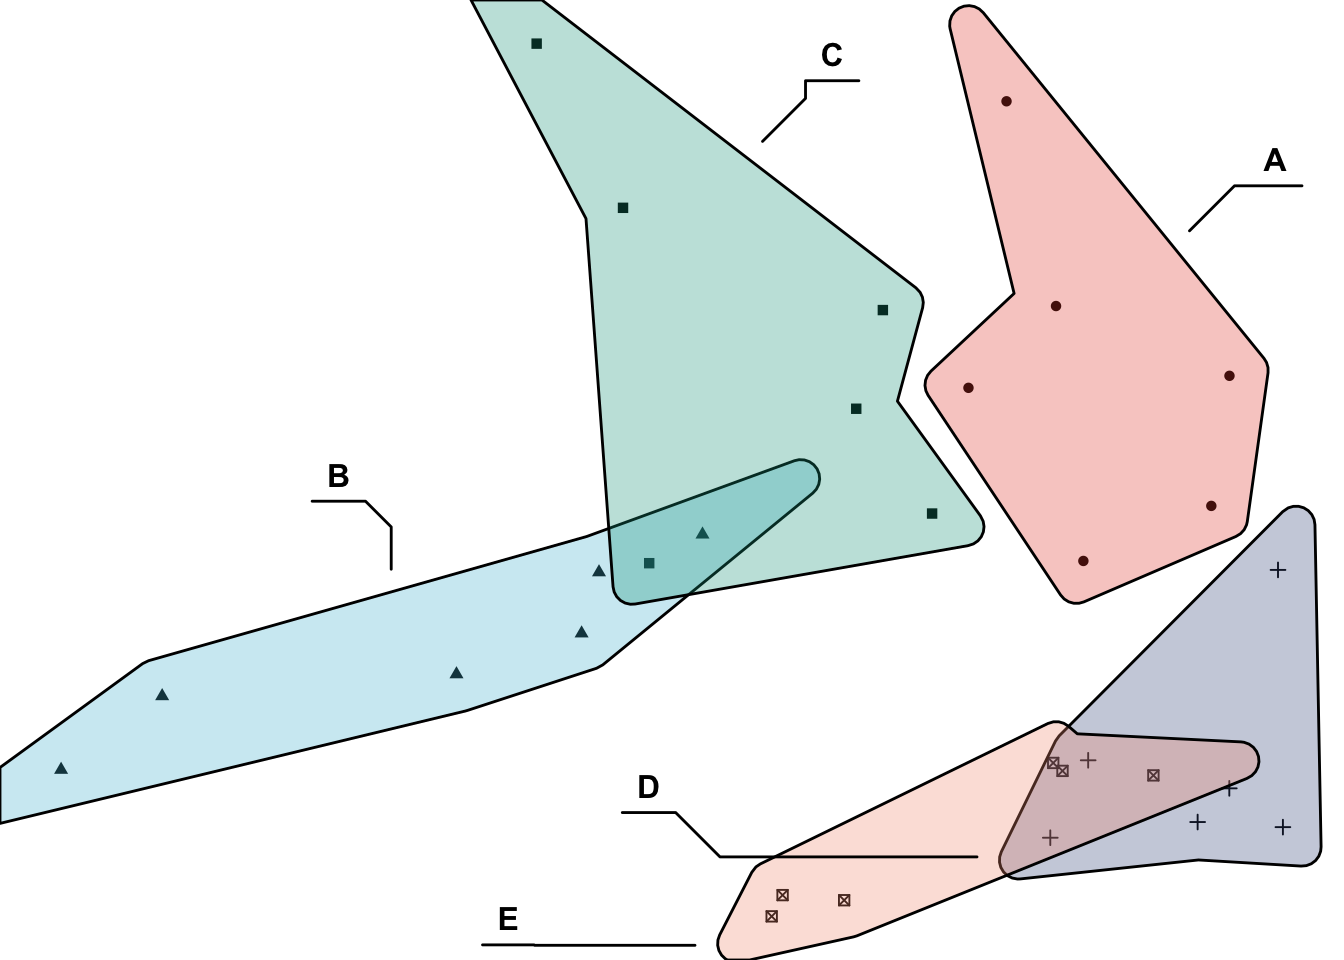
Make a distance object:
Dist <- dist(df %>%
               select(-group) %>%
               column_to_rownames("SampleID")) ## euclidean
Which samples are in which group?
Gr <- df$group
names(Gr) <- df$SampleID
Make sure the order of the grouping is the same as Dist:
Gr <- Gr[colnames(as.matrix(Dist))]Create a data frame of distances between groups of items using dist_groups from usedist package (https://github.com/kylebittinger/usedist):
Dist_Gr <- dist_groups(Dist, Gr)
Dist_Gr %>%
  head() %>%
gt()| Item1 | Item2 | Group1 | Group2 | Label | Distance |
|---|---|---|---|---|---|
| A1 | A2 | A | A | Within A | 2.597939 |
| A1 | A3 | A | A | Within A | 2.884004 |
| A1 | A4 | A | A | Within A | 6.262525 |
| A1 | A5 | A | A | Within A | 1.457591 |
| A1 | A6 | A | A | Within A | 3.458273 |
| A1 | B1 | A | B | Between A and B | 4.746163 |
What are the distances between groups?
Dist_Between_Groups <- Dist_Gr %>%
  arrange(Label, Distance) %>%
  filter(!duplicated(Label)) %>%
  mutate(Distance = ifelse(str_detect(Label, "^Within "), 0, Distance)) %>%
  mutate(rowItem = str_remove_all(Label, "^Between | and .+|^Within ")) %>%
  mutate(colItem = str_remove_all(Label, "^.+ and |^Within ")) %>%
  select(Item1, Item2, rowItem, colItem, Label, Distance)

Dist_Matix <- Dist_Between_Groups %>%
  select(-Item1, -Item2, -Label) %>%
  pivot_wider(names_from = "colItem", values_from = "Distance", values_fill = list(Distance = 0)) %>%
  column_to_rownames("rowItem")

Dist_Matix <- Dist_Matix[, rownames(Dist_Matix)] # arrange columns
Dist_Matix <- Dist_Matix + t(Dist_Matix) # make a symmetric matrix
Now distances between groups are:
Dist_Matix %>%
  rownames_to_column() %>%
gt(rowname_col = "rowname")| A | B | C | D | E | |
|---|---|---|---|---|---|
| A | 0.000000 | 3.2739052 | 1.1348300 | 1.0844749 | 2.7477679 |
| B | 3.273905 | 0.0000000 | 0.5067407 | 4.8572852 | 4.0505295 |
| C | 1.134830 | 0.5067407 | 0.0000000 | 3.4722629 | 3.5756031 |
| D | 1.084475 | 4.8572852 | 3.4722629 | 0.0000000 | 0.2894509 |
| E | 2.747768 | 4.0505295 | 3.5756031 | 0.2894509 | 0.0000000 |
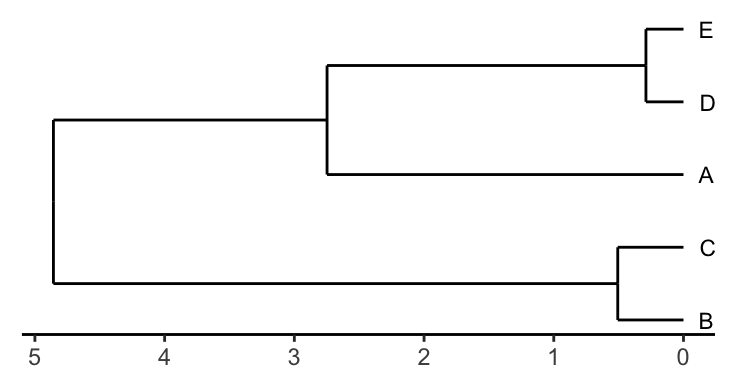
Which samples achieve the minimum distances? How about dendrogram?
whichSamplesFirst <- Dist_Between_Groups %>%
  select(Item1, Label) %>%
  mutate(Item1 = as.character(Item1)) %>%
  left_join(df %>% select(-group), by = c("Item1" = "SampleID")) %>%
  rename(x1 = x, y1 = y)

whichSamplesSecond <- Dist_Between_Groups %>%
  select(Item2, Label) %>%
  mutate(Item2 = as.character(Item2)) %>%
  left_join(df %>% select(-group), by = c("Item2" = "SampleID")) %>%
  rename(x2 = x, y2 = y)

whichSampleCombined <- whichSamplesFirst %>%
  left_join(whichSamplesSecond, by = "Label") %>%
  filter(str_detect(Label, "^Between "))

g_distance <- df %>%
  mutate(repel_label = ifelse(SampleID %in% c(whichSampleCombined$Item1, whichSampleCombined$Item2),
                              SampleID, "")) %>%
  ggplot(aes(x, y)) +
  geom_point(aes(shape = group), show.legend = FALSE) +
  geom_mark_hull(aes(label = group, fill = group),
                 show.legend = FALSE) +
  scale_color_d3() +
  scale_fill_npg() +
  geom_text_repel(aes(label = repel_label)) +
  geom_segment(data = whichSampleCombined,
               aes(x = x1, y = y1, xend = x2, yend = y2, color = Label)) +
  theme_void()

hc <- hclust(as.dist(Dist_Matix))
hcdata <- dendro_data(hc, type = "rectangle")

g_dendro <- segment(hcdata) %>%
  ggplot() +
  geom_segment(aes(x, y, xend = xend, yend = yend)) +
  geom_text(data = hcdata$labels, aes(x, y, label = label),
            hjust = -1, size = 3) +
  coord_flip() +
  scale_y_reverse() +
  theme_classic() +
  theme(axis.line.y = element_blank(),
        axis.text.y = element_blank(),
        axis.ticks.y = element_blank(),
        axis.title = element_blank())
g_distance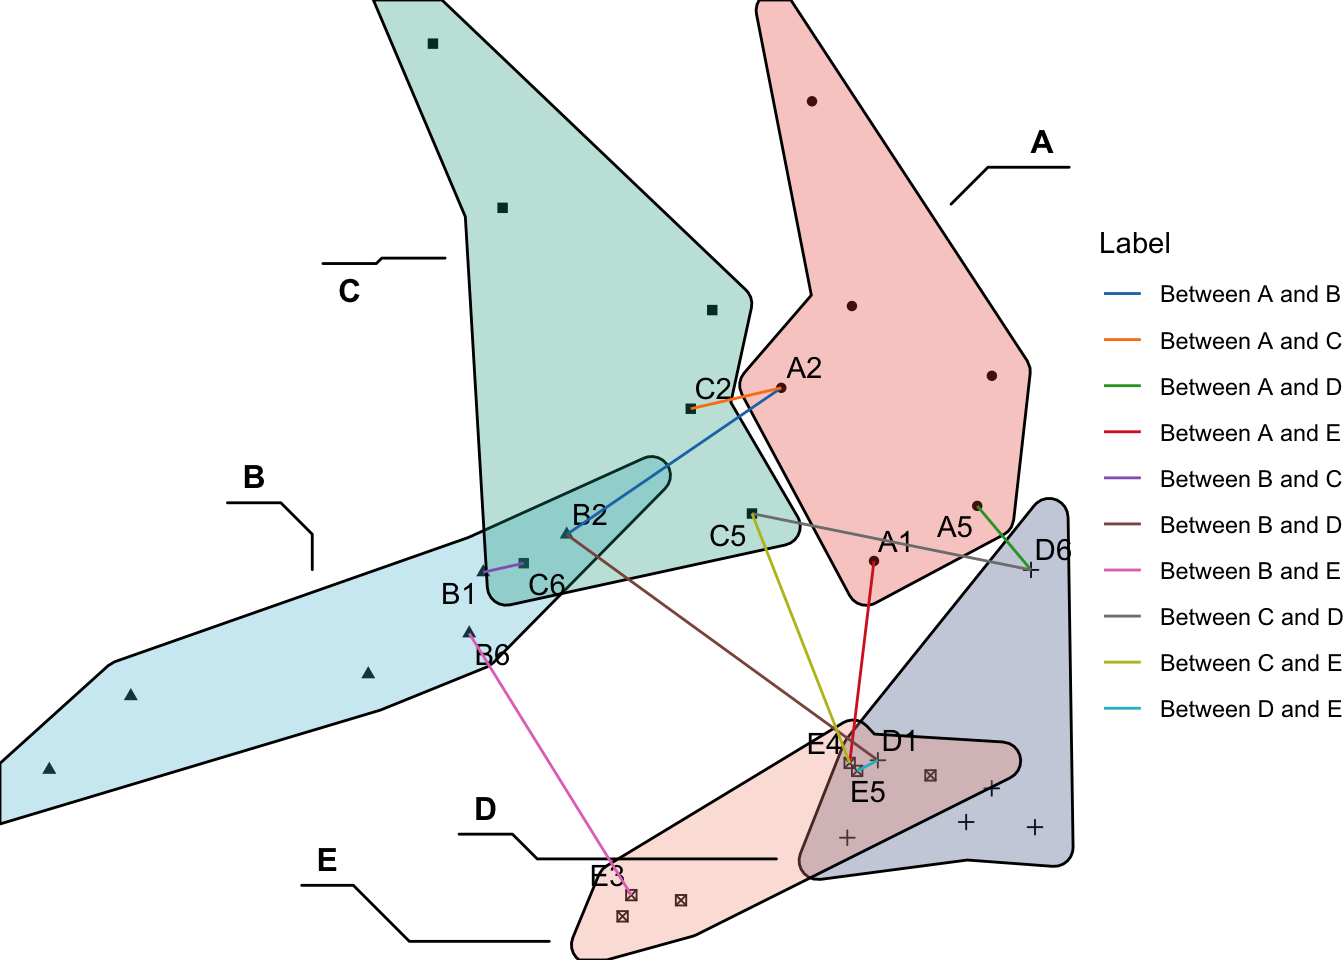
g_dendro